Measuring Organizational Progress
Are we making Progress?
Using the Baldrige questionnaire (Baldrige Website) and survey results can provide volumes of information about how well your organization is progressing in its journey toward success.
The following graphs were derived from the 2011 survey on the Baldrige Board of Examiners. The Examiner self-identified themselves as member of a workforce (BPEP) or leaders (BPEPal).
- BPEP, which represents the result from Examiners (n = 173) using the standard survey “Are We Making Progress?”. Let’s consider this data “workforce data”.
- BPEPal represents the Examiners (n = 294) that responded using “Are We Making Progress as Leaders?”. Let’s consider this set of data “leader data”.
Some broad assumptions are made. The primary assumption is: this is NOT one organization’s data, but an assimilation of individual responses from Examiner’s experience of their current employer.
Top-Box Results: The survey uses a five-point Likert scale. A response of “Agree” and “Strongly Agree” has been combined to represent what is consider the Top-Box results. For example, if 58% Agreed and 12% Strongly Agreed the Top-Box result is 70%.
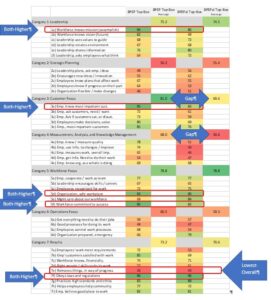
Here are some initial observations and notes regarding the results (Figure 1):
- Higher Top-Box results is better.
- The Top-Box grand-average for BPEP is 71.3% (better), with BPEPal (as leaders) is 66.8%.
- Five of the “Category Averages” are closer together, with some spread in Category 3 and 4.
- From this Category 3 and 4 information, we can make two assumptions:
- (1) the leader’s may have a closer relationship with the customer and could be more critical in their survey response, and
- (2) they may be closer to day-to-day organizational results (more knowledgeable) and assuredly would be more engaged in the profit and loss responsibilities.
- A broader assessment evaluates the lowest average for the single question 7e regarding “removal of things in the way of progress”, both result in the 30s and 40s.
- The top five higher values are the responses to questions 1a, 3a, 5d. 5f, and 7f, including topics on mission, importance, safe, success, and laws / regulations. All good things!
Figure 1 – Overall Results
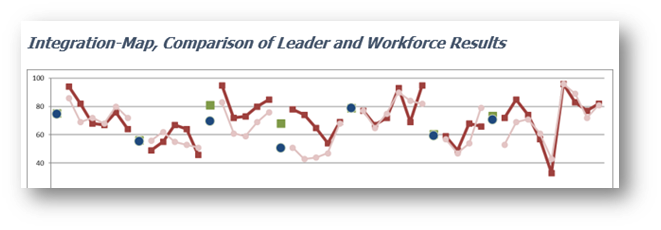
Integration-Maps also point to the lower fruit. Management has the right cultural base and overall attitude within the workforce (i.e., 1a, 3a, 5d. 5f, and 7f), but both management and the workforce know about roadblocks (7e; Our organization removes things that get in the way of progress).
Figure 2 – Integration-Map, Comparison of Leader and Workforce Results
Observations include:
- Category 1: Results fall as we transition down from 1a) Mission to 1f) ask what think. This questions the ability to deploy Mission, Vision, Values, environment and seek feedback.
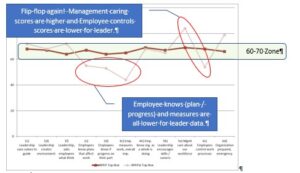
- Category 2: Leader results are lower for 2c) know plans and 2d) employees know progress. This questions knowledge of the value its work and contribution to organizational success.
- Category 3: The V-shaped signatures are similar, but the leader results are more pessimistic. The two lowest responses are regarding “The Employee asks . . .” dealing in communication.
- Category 4: Has the most striking delta between Leader and Workforce. Employee knows 4a), Employee use 4b), and Employee measures 4c) show the lack of knowledge of its work.
- Category 5: Is quite a flip-flop. Leader give themselves points for 5e) Management cares, while the workforce gives themselves points for 5f) workforce is committed.
- Category 6: Employees believe they have better control of 6c) work processes, and Leaders believe they are less prepared for emergencies 6d).
- Category 7: The overall signature is the same, with 7a) meet requirement and 7b) customer satisfaction both lower for Leaders. Roadblocks 7e) is still the tipping point in the results.
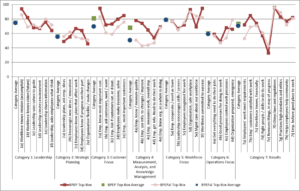
- Leader high to low averages; Workforce (78.8), Leadership (74.5), Results (70.6), Customer Focus (69.6), Operations (59.3), Strategic Planning (55.4), and Category 4 at (50.6).
- Workforce high to low averages; Customer Focus (81.0), Workforce (78.8), Leadership (75.2), Results (73.2), Category 4 (68.0), Operations (60.5), Strategic Planning (56.2).
Figure 3 – Top-Box Scores @ 90-100 for Leaders (BPEPal)
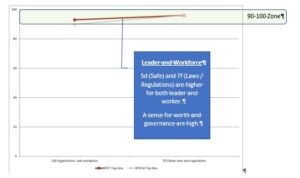
Figure 4 Top-Box Scores @ 90-100 for Workforce (BPEP)
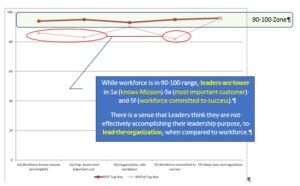
Figure 5 – Top-Box Scores @80-90 for Leaders (BPEPal)
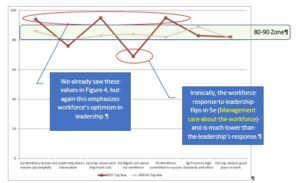
Figure 6– Top-Box Scores @80-90 for Workforce (BPEP)
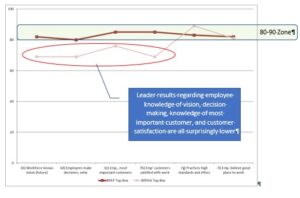
Figure 7 – Top-Box Scores 70-80 for Leaders (BPEPal)
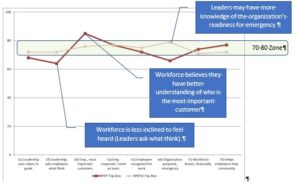
Figure 8 – Top-Box Scores 70-80 for Workforce (BPEP)
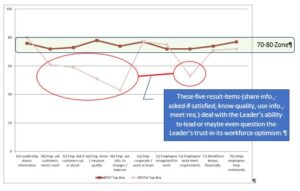
Figure 9 – Top-Box Scores 60-70 for Leaders (BPEPal)
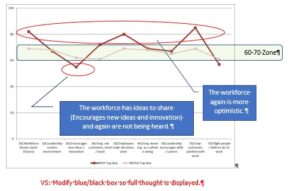
Figure 10 – Top-Box Scores 60-70 for Workforce (BPEP)
These interpretations again are only assumptions, but hopefully you see the advantage of the survey and understanding how integration impacts results (both positive and negative).
The analysis in this post is only an analysis between Leadership and Workforce (i.e., level). To improve our analysis, we should add trend. Leadership should repeat the survey in a 1–2-year period. Hopefully, if appropriate post-survey action is taken then positive trends will be seen. Conduct the survey at a frequency to sustain current results and support the improvement process.
The next improvement to our analysis is to add comparison data. You can use the raw data in post for comparison or source data from comparable or best-in-class organizations.
Do not forget to consider internal comparative data, which is segmentation. Conduct your survey by region, age, gender, new employee vs long-term employee, department, emerging market groups, or any method that is found acceptable and resourceful for your organization’s success.
Ultimately, the key is to use integration and learn from these exercises. Use the ADLI Cycle and look for related Approaches, effectiveness of Deployment, opportunities for Learning and Integrate it back into the organization.
Use this approach to help you refine and build new strength and maturity within your organization. A new post in the series Integration within the Organization is coming next week. Hope to see you there.

Paul Dreiss
Quality Advisor
Paul Dreiss has a proven track record of establishing and revitalizing organizational quality systems in multiple industries and service organizations. Two areas of focus include: Quality Management System – Developed organizational policies, procedures and work instructions that your…